×


 x 

Shopping cart
29%OFFNathan Yau - Data Points: Visualization That Means Something - 9781118462195 - V9781118462195
Stock image for illustration purposes only - book cover, edition or condition may vary.

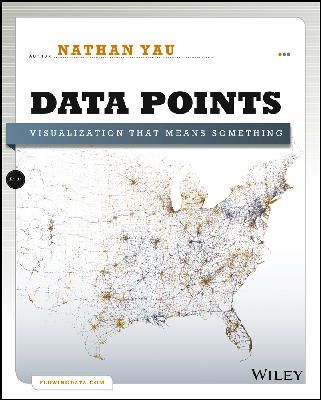
Data Points: Visualization That Means Something

€ 44.99
€ 31.89
You save € 13.10!
FREE Delivery in Ireland
Description for Data Points: Visualization That Means Something Paperback.

A fresh look at visualization from the author of Visualize This

Whether it's statistical charts, geographic maps, or the snappy graphical statistics you see on your favorite news sites, the art of data graphics or visualization is fast becoming a movement of its own. Num Pages: 320 pages, black & white tables, maps, figures. BIC Classification: AKC; UG. Category: (P) Professional & Vocational. Dimension: 231 x 190 x 20. Weight in Grams: 742.

A fresh look at visualization from the author of Visualize This

Whether it's statistical charts, geographic maps, or the snappy graphical statistics you see on your favorite news sites, the art of data graphics or visualization is fast becoming a movement of its own. In Data Points: Visualization That Means Something, author Nathan Yau presents an intriguing complement to his bestseller Visualize This, this time focusing on the graphics side of data analysis. Using examples from art, design, business, statistics, cartography, and online media, he explores both standard-and not so standard-concepts and ideas about illustrating data.

  • Shares intriguing ideas from ... Read more
  • Focuses on visualization, data graphics that help viewers see trends and patterns they might not otherwise see in a table
  • Includes examples from the author's own illustrations, as well as from professionals in statistics, art, design, business, computer science, cartography, and more
  • Examines standard rules across all visualization applications, then explores when and where you can break those rules

Create visualizations that register at all levels, with Data Points: Visualization That Means Something.

Show Less

Product Details

Publisher
John Wiley & Sons Inc United States
Number of pages
320
Format
Paperback
Publication date
2013
Condition
New
Number of Pages
320
Place of Publication
New York, United States
ISBN
9781118462195
SKU
V9781118462195
Shipping Time
Usually ships in 4 to 8 working days
Ref
99-2

About Nathan Yau
Nathan Yau has a PhD in statistics and is a statistical consultant who helps clients make use of their data through visualization. He created the popular site FlowingData.com, and is the author of Visualize This: The FlowingData Guide to Design, Visualization, and Statistics, also published by Wiley.

Reviews for Data Points: Visualization That Means Something
"Data Points opens an exciting view of information blending data analysis, visual interaction, and digital storytelling... the visuals are stunning." (Managing Information, October 2013) "Ultimately, I would recommend this book for anyone interested in the process of design and analysis. It is about making sense of data and that is becoming a crucial skill in this digital age." ... Read more

Goodreads reviews for Data Points: Visualization That Means Something


Subscribe to our newsletter

News on special offers, signed editions & more!