4%OFF

Stock image for illustration purposes only - book cover, edition or condition may vary.
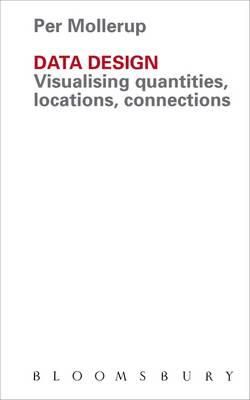
Data Design: Visualising Quantities, Locations, Connections
Professor Per Mollerup
€ 48.99
€ 46.79
FREE Delivery in Ireland
Description for Data Design: Visualising Quantities, Locations, Connections
Paperback. Num Pages: 176 pages, 11 colour tables, 1 bw table, 82 colour charts/graphs, 69 bw charts/graphs, 40 colour ill. BIC Classification: ACX; AKC. Category: (G) General (US: Trade). Dimension: 242 x 152 x 14. Weight in Grams: 444.
Data Design: Visualising quantities, locations, connections is a lively and comprehensive introduction to data visualisation, illustrated with 199 instructive data displays. The book is for designers, journalists, editors, writers and anyone concerned with presenting factual information in a clear and effective way.
Data Design highlights the key qualities of good data visualisation: accuracy, simplicity, and clarity. In this spirit, Per Mollerup discusses information design with great clarity. The proposed data displays are as simple as possible, and every graphic element is there to convey meaning. This book is not about data decoration.
Data Design can be read from ... Read more
Product Details
Publisher
Bloomsbury Publishing PLC United Kingdom
Number of pages
176
Format
Paperback
Publication date
2015
Condition
New
Number of Pages
176
Place of Publication
London, United Kingdom
ISBN
9781408191873
SKU
V9781408191873
Shipping Time
Usually ships in 4 to 8 working days
Ref
99-2
About Professor Per Mollerup
Per Mollerup is Professor of Communication Design at Swinburne University of Technology, Melbourne, Australia. He previously edited and published Mobilia Design Magazine and Tools Design Journal in Copenhagen, Denmark. From 1984–2009 he was the owner and principal of Designlab in Copenhagen, an award-winning design consultancy specialising in wayshowing and branding. He is the author of several books on design, including ... Read more
Reviews for Data Design: Visualising Quantities, Locations, Connections
Data Design makes a strong and clear attempt to describe the principles and practices of data visualisation needed to make data easily perceptible ... The book is very practical, no specialist tools are required ... [and it] also supports critical thinking ... A useful reference guide ... both parsimonious and comprehensive.
She Ji: The Journal of Design, Economics, and ... Read more
She Ji: The Journal of Design, Economics, and ... Read more
